Usually, when a particular currency is trending up against the US dollar, the noncommercials
tend to register a net long position since these large speculators tend
to ride on the existing trend. The opposite situation is true too: the non-commercials
tend to register a net short position when a particular currency is trending down
against the US dollar. Knowing whether this category has been net long or short a
few days ago only indicates to us the positioning in retrospect; this information is
only useful if you compare the latest net positioning with the positioning figures
from the past few weeks or months
By comparing the latest net positioning with that of the past few weeks or months
you can tell if the latest net long or net short positioning is skewing towards an
extreme reading. My observation of the financial markets is that dramatic price
moves, usually at major turning points, tend to occur when the majority of the market
is positioned incorrectly. And since the large speculators are more inclined to close
their losing positions than the commercial hedgers, it is beneficial for us to keep an
eye on their net directional positioning as well as their net contract volume in the
currency futures market. If these large non-commercials are positioned on the wrong
side of the market, you can expect liquidation of these positions, with the extent of
liquidation depending on the total volume of contracts traded in the wrong direction
For example, if these large funds are holding large (extreme) net long GBP
positions, but GBP is declining against the US dollar due to some external catalysts
like news, they will eventually have to close their longs when their stops are
triggered, or decide to close their longs before getting stopped out and switch to
shorting GBP on the way down. Such mass unwinding of positions tends to bring
about a powerful price move in the opposite direction which could last for a few
days, and it is this turning point that you could detect with the COT data before the
reversal scene actually plays out
Example: COT – using extreme position
17,2006-An example of this was played out in the week through November 13
. The COT report that was released on November 10
showed that, as of the previous Tuesday on November 7, large
speculative funds upped their net GBP longs to a multi-year high of
+84,280 contracts, a figure which clearly shows up as an extreme
positioning on the chart as shown in Figure 5.5
In this case, all those who had the intention to go long on GBP had
already done so. As a result of this extreme net speculative
positioning of GBP longs on the CME, GBP/USD in the spot market
proceeded to decline by more than 300 pips in the following week
.through November 13-17, 2006 (Figure 5.6
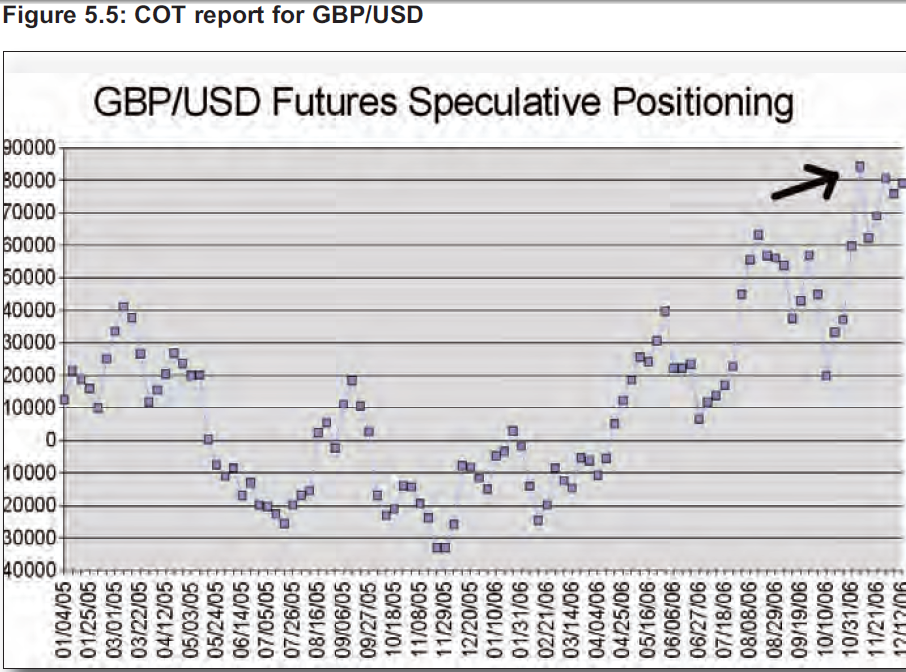
This chart shows the net speculative (
non-commercial) positions in GBP
futures on the CME. X-axis displays the dates for every three weeks even
though the data for every week is shown on the chart. Y-axis displays the net
number of speculative contracts. Positive numbers indicate net long
positioning, while negative numbers indicate net short positioning